Mind Map your Financial Plan

We all know how important Financials are in a business. After all, it is the reason why the business exists in the first place.
While this is so important, it is often difficult to communicate or plan the finances of your business using traditional tools. While a spreadsheet or accounting program is essential in working out the details, what you need to do and communicate often gets lost in the details.
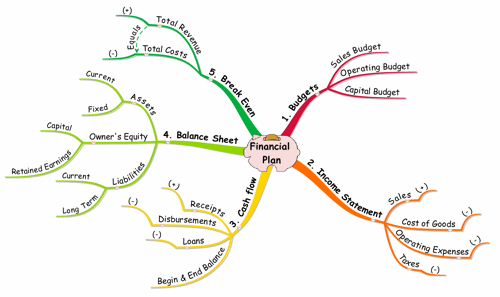
This is where a summary Mind Map of your Financial Plan comes into its own. The above Mind Map shows you exactly what you need for your business. This is especially true when starting up a new business. We will walk you through the Mind Map to help you get your financial plan in place.
A Mind Map Financial Plan will enable you to keep a holistic view of your business financial plan and enable you to communicate it when necessary.
Subscribe to Using Mind Maps
Get Access to the Best Mind Mapping Tips, Tools, Techniques Resources and Opinions.
Budgets
There are three budgets that you need to prepare:
- Sales Budget
- Operating Budget
- Capital Budget
Operating Budget This is a list of all your fixed costs and all your variable costs. Fixed costs are costs that are relatively constant over the planned period, while variable costs often vary based on the volume of sales.
By breaking this down into detail, you can more effectively develop the pro forma statements discussed below.
Examples of fixed costs: rent, utilities, salaries, interest, depreciation, insurance.
Examples of variable costs: Advertising and selling expenses.
Capital Budget Your capital budget helps you evaluate expenditure that will impact your business for more than a year.
Examples are: new equipment, computers, vehicles, etc.
Pro Forma Income Statements
An income statement is simply a record of income versus expenditure over a period.
Sales (+) The major source of income in most cases is sales. Your sales budget as explained above will reflect your projected sales.
Based on the number of units sold and the cost of each unit, you can work out the cost of sales, or cost of goods sold.
After subtracting the cost of sales from your sales, you will be left with a projected Gross Profit.
Expenses (-) You now need to subtract your expenses from your Gross Profit.
Operating Expenses The bulk of your expenses are related to operating expenses and include the following:
- Selling expenses
- Advertising
- Salaries and Wages
- Office Supplies
- Rent
- Utilities
- Insurance
- Taxes
- Interest
- Depreciation
- Etc.
Taxes Subtracting your estimated taxes will leave you with your Net Profit.
Pro Forma Cash Flow
It is important for you to note that Cash Flow is not the same as Profit. Profit deals with sales and costs, while Cash flow deals with cash received and cash paid.
Cash only flows when actual payments are received or made.
Not all bills, for example, get paid immediately, but your income statement would already have recorded it as an expense.
This is arguably the most important statement to manage in your business. Many profitable businesses have gone under because of poor cash flow management, especially small or medium size businesses.
Pro Forma Balance Sheet
The Pro Forma Balance Sheet reflects the state of the business at the end of the first financial year. It summarises the assets, liabilities and net worth of the owners.
The basic accounting equation is: Assets = Owner's Equity + Liabilities
Assets This is everything of value owned by the business. Current assets are any assets that will be converted to cash within a year. Fixed assets are assets that will be used over a long period of time.
Liabilities A liability is anything that is owed by the business to someone else. Current liabilities are those that are due within a year. Long term debts are payable over a longer period.
Owner's Equity This is the stake that the owner has in the business and is calculated as what is left after all liabilities are subtracted from the the assets.
It therefore reflects the net worth of the business.
Break Even Analysis The Break Even Point is the point at which the business neither makes a profit nor a loss. It is the point at which the business will start to make profits and tells you how much must be sold in order to break even.
It is determined by calculating the number of sales needed to cover both the variable and fixed expenses based on the current selling price.
Conclusion You can put the results of each of this into a Mind Map Financial Plan, using the summary headings in the Mind Map above. You could also add more details to the branches, as you see fit.
Your Mind Map of your Financial Plan will give you a quick, holistic view of your business, which is much easier to manage and communicate than the detailed spreadsheets that are needed to do the actual calculations.
Return to Using Mind Maps Home Page


